Scientific and Technological Research
Key indicators of the Cuban sugar agro-industrial value chain: content analysis by processes and dimensions of performance and sustainability
Indicadores clave de la cadena de valor agroindustrial azucarera cubana: análisis de contenido por procesos y dimensiones de desempeño y sostenibilidad
Yasniel Sánchez Suárez1  *, Pietro Mendonça
de Santis Sica2 *, Darian Samá Muñoz3
 *
ABSTRACT
Introduction: The sugar agroindustry has historically been a main pillar of the Cuban economy, and its shift toward a sustainable model required indicator systems capable of integrating the productive, economic, social, environmental, and technological aspects of the value chain. The goal was to characterize the key indicator system of the Cuban sugar agroindustrial value chain through a content analysis by key process and by performance and sustainability dimensions.
Methodology: A mixed approach was applied, of a descriptive-analytical type, through documentary and content analysis of the institutional indicator matrix, with a coding scheme covering seven dimensions of performance and sustainability.
Results: The results showed 124 indicator relationships, mostly concentrated in the production and capacity dimensions (23.4%), physical resources and inputs (19.4%), compared to a low representation in the economic-financial dimension (8.1%) and innovation and technology (3.2%), the latter without explicit quantitative indicators in support processes. Comparison with the literature showed a contrast: a greater emphasis on environmental aspects and digitalization in international literature.
Conclusions: It was concluded that the indicator system needs a rebalance towards environmental sustainability and innovation to align with recent frameworks for measuring the performance of agro-industrial value chains.
Keywords: Agricultural Economics, Agricultural Statistics, Food Industry, Sustainable Development.
JEL Classification: L66, O33, Q13.
RESUMEN
Introducción: La agroindustria azucarera constituyó históricamente un eje principal de la economía cubana, y su reconversión hacia un modelo sostenible demandó sistemas de indicadores capaces de integrar las dimensiones productiva, económica, social, ambiental y tecnológica de la cadena de valor. El objetivo fue caracterizar el sistema de indicadores clave de la cadena de valor agroindustrial azucarera cubana, mediante un análisis de contenido por proceso clave y por dimensión de desempeño y sostenibilidad.
Metodología: Se aplicó un enfoque mixto, de tipo descriptivo-analítico, mediante análisis documental y de contenido sobre la matriz de indicadores institucional, con un esquema de codificación en siete dimensiones de desempeño y sostenibilidad.
Resultados: Los resultados evidenciaron 124 relaciones de indicadores, concentradas en las dimensiones de producción y capacidad (23.4 %), recursos físicos e insumos (19.4 %), frente a una baja representación de las dimensiones económica-financiera (8.1 %) y de innovación y tecnología (3.2 %), esta última sin indicadores cuantitativos explícitos en los procesos de apoyo. La comparación con la literatura mostró un contraste: mayor peso de lo ambiental y la digitalización en la literatura internacional.
Conclusiones: Se concluyó que el sistema de indicadores requiere un rebalanceo hacia la sostenibilidad ambiental y la innovación para alinearse con marcos recientes de medición del desempeño de cadenas de valor agroindustriales.
Palabras clave: Desarrollo Sostenible, Economía Agraria, Estadísticas Agrícolas, Industria Alimentaria.
Clasificación JEL: L66, O33, Q13.
Received: 10-05-2026 Revised: 10-08-2026 Accepted: 15-09-2026 Published: 22-09-2026
Editor:
Alfredo Javier Pérez Gamboa
1Universidad de Matanzas. Matanzas, Cuba.
2Universidade de São Paulo. São Paulo, Brasil.
3Universidad Agraria de La Habana. Mayabeque, Cuba.
Sánchez Suárez, Y., Mendonça de Santis Sica, P., & Samá Muñoz, D. (2026). Indicadores clave de la cadena de valor agroindustrial azucarera cubana: análisis de contenido por procesos y dimensiones de desempeño y sostenibilidad. Región Científica, 5(2), 2026642. https://doi.org/10.58763/rc2026642
INTRODUCTION
The competitiveness of agro-industries depends largely on the capacity of their supply and value chains to generate, capture, process, and utilize information and knowledge regarding the performance of all their constituent links. Porter (1985) defined the value chain as the disaggregation of an organization into relevant primary and support activities; from this perspective, value chain analysis became a key tool for identifying sources of competitive advantage and differentiation in an increasingly globalized market. Walters and Lancaster (2000) introduced the concept of value strategy, noting that chain competitiveness required internal efficiency and coordination. Subsequently, Gereffi et al. (2005) incorporated the governance dimension into global value chain analysis, demonstrating that the distribution of power among actors—producers, suppliers, buyers, marketers, and regulators—decisively influenced what information was measured, what was targeted for control and by whom, and the shared purpose of all links in the chain.
Research focused on performance measurement revealed an evolution from systems centered on economic-financial indicators toward multidimensional frameworks that explore internal processes, customer satisfaction, and staff training and development. Neely et al. (1995) addressed this transition and warned of the risk of indicators that merely replicated historical biases toward economic-financial metrics without delving into operational capabilities, quality, or innovation; in a later study, Neely et al. (2000) proposed adopting a process-based approach for the design and updating of these systems. In this regard, Bourne et al. (2000) emphasized that, while the initial design is important, the periodic updating and adjustment of indicators are equally crucial. Kaplan and Norton (1992) proposed the balanced scorecard as a concrete tool, establishing a balance among financial, customer, internal process, and organizational learning perspectives. In the specific context of supply chains, Gunasekaran et al. (2004) proposed a performance measurement framework structured by planning levels (strategic, tactical, and operational) and supply chain links; this framework was later updated by Gunasekaran and Kobu (2007) through a systematic literature review on logistics and supply chain metrics. Meanwhile, Beamon (1998) emphasized that supply chain design should be evaluated simultaneously in terms of resources, outputs, and flexibility—three categories that anticipated many of the multidimensional classification schemes used today.
In addition to these contributions, the discussion on corporate sustainability expanded in the late 1990s; Elkington (1997) introduced the "triple bottom line" concept to integrate economic, social, and environmental dimensions into business performance evaluation. Seuring and Müller (2008) subsequently applied this approach—via a literature review—to sustainable supply chain management (SSCM), identifying the primary barriers to its implementation. Carter and Rogers (2008) advanced the theory of sustainable supply chain management (SSCM) by linking the three sustainability dimensions with other supporting processes—such as risk management, transparency, strategy, and organizational culture—a framework that Carter and Easton (2011) later updated through a systematic review of empirical research. Ahi and Searcy (2013) formally compared definitions of green management and SSCM, while Jabbour et al. (2013) systematized the most widely studied green management practices (cleaner production, eco-design, reverse logistics, and green purchasing) and noted the persistent scarcity of studies focusing on social and governance dimensions, in contrast to the predominance of the environmental dimension in the strict sense.
In the specific case of the sugarcane agro-industry, international literature has documented similar barriers across sustainability dimensions; in this regard, Viegas et al. (2024), in a systematic review of sustainability indicators in sugarcane production, identified a clear predominance of environmental and economic-financial indicators over social ones. In Brazil, numerous studies have addressed the technical and environmental efficiency of processing plants: Bordonal et al. (2018) comprehensively reviewed the sustainability of Brazilian sugarcane production; Duarte et al. (2019) and Lemos et al. (2019) identified agro-industrial practices associated with the technical efficiency of sugar and ethanol mills; Carlucci et al. (2021) compared environmental factors and impurity levels between Brazilian and Australian mills; and Gonçalves et al. (2021) proposed strategies to simultaneously improve the environmental efficiency and economic profitability of these facilities.
From a life cycle assessment (LCA) perspective, Ometto et al. (2009) evaluated Brazilian sugarcane ethanol, while Tsiropoulos et al. (2014) compared that production with India's, and Rodrigues and Machado (2024) updated the LCA of the sugarcane supply chain in Brazil's Central-West region. Jonker et al. (2016) and Khatiwada et al. (2016) optimized the configuration of bioenergy supply chains based on sugarcane and eucalyptus, whereas Kadwa and Bezuidenhout (2015) and Santoro et al. (2017) addressed the consistency of sugarcane supply to a South African mill and the optimization of mechanized harvesting routes, respectively. Higgins (2006) and Renouf et al. (2013) documented Australian experiences regarding the optimization of sugarcane transport and product diversification with an environmental focus. In Asia, Yuttitham et al. (2011) and Prasara-A et al. (2019) evaluated the carbon footprint and the social and environmental sustainability of sugarcane-derived products in Thailand, while Singh et al. (2025) applied system dynamics to analyze the Indian sugar supply chain. García et al. (2016) provided evidence on the carbon footprint of Mexican sugar production, and Machado and Da Cruz (2022) analyzed the socioeconomic sustainability of the international sugarcane trade.
In the Latin American and Caribbean context, Contreras-Lisperguer et al. (2018) used Life Cycle Assessment (LCA)—incorporating environmental, economic, and social perspectives—to evaluate electricity cogeneration from sugarcane bagasse in Jamaica; this provides a key reference for the comprehensive sustainability assessment of a sugar agro-industry structurally similar to Cuba's. Meanwhile, Chávez et al. (2020) and Gilani et al. (2020) proposed programming models for the sustainable planning of upstream operations and sugarcane bioethanol supply networks. In contrast, Mota et al. (2015) offered a general framework for the design and planning of sustainable supply chains that explicitly integrated the three dimensions of sustainability.
Regarding these results within the agro-industrial context, two directly relevant trends were identified: (1) the water-energy-food nexus approach—characterized by Correa-Porcel et al. (2021) as an emerging framework for the agri-food sector and analyzed by Hamidov and Helming (2020) specifically regarding agriculture or water-intensive agricultural products; in this same vein, Zarei et al. (2021) developed and prioritized sustainability indicators for agricultural systems based on this approach, while Haghjoo et al. (2022) constructed and validated tools to assess this relationship at the farm level; and (2) digitalization and Industry 4.0 technologies as a significant component of agri-food indicator systems: Hassoun et al. (2023) reviewed applications of digital transformation in the agri-food industry, whereas Morella et al. (2021) systematized the implementation of Industry 4.0 technologies across the agri-food supply chain and proposed key indicators to measure their benefits. From a social perspective, Orou Sannou et al. (2023) systematically reviewed social sustainability indicators in agri-food systems. They concluded that, despite recent growth, this dimension remains less developed than the economic and environmental dimensions—a finding consistent with that reported by Jabbour et al. (2013) regarding green supply chain management in general.
In Cuba, the sugar agro-industry was a strategic pillar of the national economy; over time, it underwent restructuring, highlighting the need for indicator systems capable of simultaneously monitoring agricultural, industrial, commercial, economic-financial, environmental, and social performance across the entire supply chain—all within a context of financial, energy, input, and technological constraints. Recent studies on sugar supply in Matanzas utilized statistical forecasting (García-López et al., 2024) and machine learning techniques (García et al., 2022) to improve industrial planning based on historical series of physical supply chain indicators; these studies demonstrated both the availability of quantitative data in the region and the need to systematize and critically evaluate the set of indicators used to build those mathematical models. Meanwhile, Sánchez Suárez et al. (2026) propose an integrated framework that accounts for the adoption of artificial intelligence and the circular economy in the management of sugar agro-industrial value chains.
Despite the volume of international literature on the sustainability of the sugar value chain, studies providing a systematic characterization—based on institutional documentation—of the complete input-output indicator system for a specific sugar value chain (broken down by key process and by performance and sustainability dimensions) were rare, as were studies comparing this structure against performance measurement frameworks and the international experience of the sugar agro-industry itself. This gap was particularly significant in the Cuban context, where the scarcity of studies published in indexed databases regarding the design of sugar value chain indicator systems stood in contrast to the sector's strategic importance to the national and regional economies.
Consequently, this research aimed to characterize the key indicator system of the Cuban sugar agro-industrial value chain through a content analysis based on key processes and dimensions of performance and sustainability.
METHODOLOGY
The research was conducted within a post-positivist paradigm using a mixed-methods approach—predominantly quantitative with a qualitative component—as it combined the systematic counting and classification of indicators (quantitative approach) with the interpretation of their semantic content for thematic coding purposes (qualitative approach). In terms of scope, the study was descriptive-analytical and cross-sectional: descriptive, as it characterized the structure of the indicator system as it existed at the time of analysis; and analytical, as it established relationships between processes, sustainability dimensions, and supply chain links, comparing them against specialized literature. The design was non-experimental and documentary, based on the content analysis of a primary institutional source (from the AZCUBA business group), without variable manipulation or intervention regarding the unit of study.
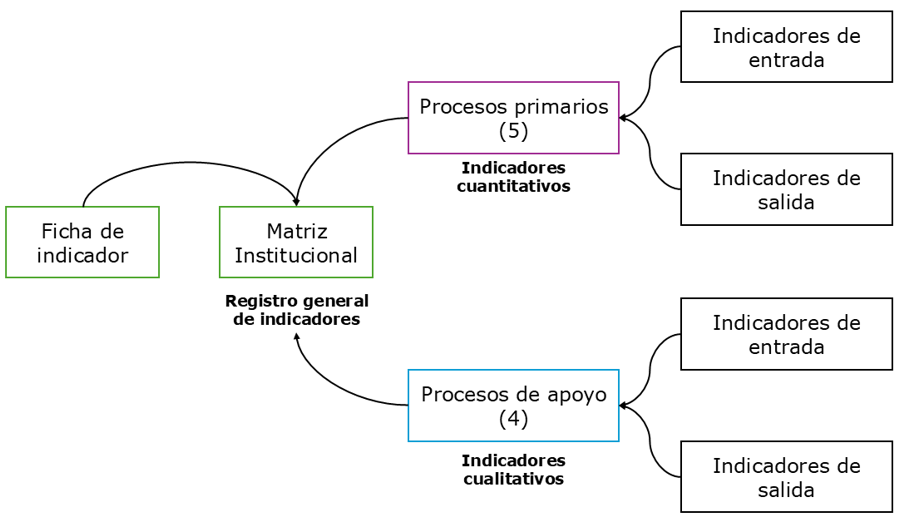
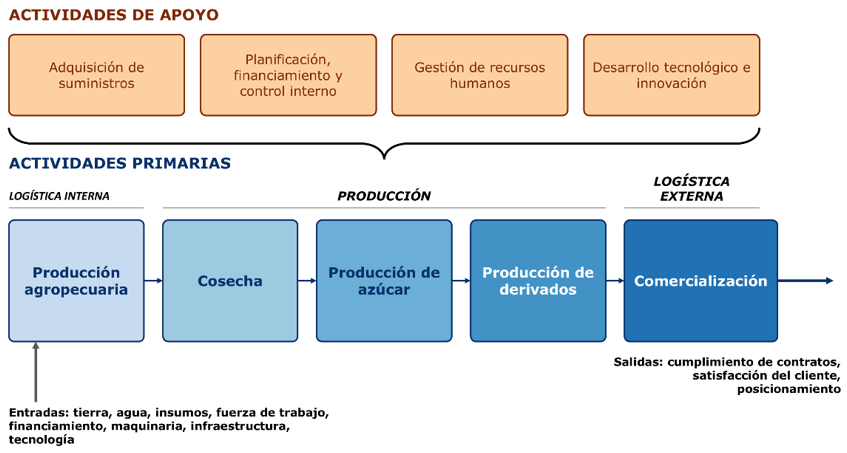
The object of study was the indicator matrix for the sugarcane value chain from the AZCUBA business group—specifically its current revised version (2026)—organized according to Porter’s (1985) value chain model into five primary processes: (1) agricultural production, (2) harvesting, (3) sugar production, (4) production of derivatives, and (5) commercialization; and four support processes: (1) procurement of supplies; (2) planning, financing, and internal control; (3) human resource management; and (4) technological development and innovation.
For each primary process, the institutional matrix documented the process inputs and outputs in a structured manner, along with the indicators associated with each input and output; for support processes, the matrix documented qualitative inputs and outputs without associated explicit quantitative indicators—a circumstance analyzed as a significant finding of the study. Specific indicator data sheets supplemented this documentary source for each primary process—available in the same institutional record—which served as a source of triangulation to verify the consistency of the indicators extracted from the general matrix (Figure 1).
Figure 1.
Analysis of information in the institutional matrix
Source: own elaboration
Note: the figure appears in its original language
Information processing
Information processing was carried out in three successive phases (Table 1).
|
Table 1. Information processing phases |
|||
|
Phases |
Name |
Actions |
Objective |
|
Phase 1 |
Extraction and normalization |
The entire content of the matrix was transcribed electronically, and the text of each indicator was standardized to identify formally identical indicators repeated across multiple processes or lists. |
Distinguish the number of indicator-process relationships from the number of unique indicators contained in the system. |
|
Phase 2 |
Thematic coding |
Each unique indicator was classified into one of seven performance and sustainability dimensions, which were deductively derived from the literature review: production and capacity; physical resources, inputs, and land; quality, market, and customer; economic-financial; labor and community; environmental and efficient resource use; and innovation and technology. |
Group the indicators according to the dimensions of sustainability. |
|
Phase 3 |
Relational analysis |
Frequency matrices were constructed cross-referencing primary and support processes with the seven sustainability dimensions, distinguishing between input and output indicators. |
Approximate the continuity of information between consecutive links in the chain. |
|
Note. All processing was carried out in a Microsoft Excel spreadsheet, ensuring the traceability and reproducibility of the indicator count based on the source file. |
|||
The coding scheme integrated Elkington’s (1997) triple bottom line approach—along with the operational breakdown proposed by Carter and Rogers (2008) and Seuring and Müller (2008)—for the economic, social, and environmental dimensions; Beamon’s (1998) distinction between resource, output, and flexibility indicators and Gunasekaran et al.’s (2004) multilevel framework for the production and resource dimensions; and the separation between market/customer and learning/innovation indicators proposed by Kaplan and Norton (1992) for the quality-market and innovation-technology dimensions.
Each indicator was coded by a single researcher based on its literal wording; ambiguous cases were recoded using an alternative criterion (sensitivity analysis), and the resulting distribution was compared with the original, revealing no variations exceeding two percentage points in any dimension.
Literature review
The literature review underpinning the theoretical framework and the discussion of results was conducted using a structured search strategy to ensure transparency in accordance with the PRISMA 2020 statement principles (Page et al., 2021), although it did not constitute a full systematic review. The Scopus, Web of Science, and SciELO databases were consulted using combinations of thematic descriptors—such as “value chain,” “sugarcane,” “sugar agro-industry,” “sustainability indicators,” and “performance measurement” and their Spanish equivalents (“cadena de valor”, “caña de azúcar”, “agroindustria azucarera”, “indicadores de sostenibilidad”, “medición del desempeño”)—restricted to peer-reviewed articles published primarily within the last 15 years; however, seminal theoretical works were included without time restrictions when they served as essential references in the field. Priority was given to scientific articles, and any references with unconfirmable metadata were excluded. The search was conducted on September 18, 2026.
Methodological limitation
It is acknowledged that the study relied on a single institutional documentary source and on coding performed by a lone researcher, without a second independent coder to allow for the calculation of an inter-researcher agreement coefficient; while this limitation was partially mitigated through triangulation with process-specific records and the described sensitivity analysis, it did not replace the robustness that multiple coding would provide in future studies.
RESULTS AND DISCUSSION
General structure of the value chain and nature of its indicators
The value chain analyzed was organized—based on Porter’s (1985) model and the proposal by Sánchez Suárez et al. (2026)—into five sequentially arranged primary activities and four cross-cutting support activities (Figure 2). This structure aligned with the sequential linkage logic described by Walters and Lancaster (2000) and the chain governance principle noted by Gereffi et al. (2005), insofar as each primary process received the outputs of the preceding process as inputs and transferred its own outputs to the next one.
Figure 2.
Structure of the sugar agro-industry value chain
Source: own elaboration based on the institutional value chain indicator matrix.
Note: the figure appears in its original language.
A key initial finding was the markedly asymmetric nature of the indicator system as it applied to primary versus support activities. While the five primary processes explicitly documented 124 relationships between indicators and processes (59 linked to inputs and 65 to outputs, representing 92 unique indicators after removing overlaps between processes), the four support activities—comprising a total of 15 management subprocesses and 26 qualitative inputs and 23 qualitative outputs—lacked any associated explicit quantitative indicators in the institutional matrix. This gap aligned with warnings from Neely et al. (1995) regarding the risk that indicator systems prioritize what is measurable and visible—in this case, primary physical production—over support functions crucial to the chain's sustainability, such as human resource management or technological development through innovation. This was particularly significant given that the institutional matrix qualitatively assigned the outputs linked to environmental management, corporate social responsibility, and the chain's technological competitiveness precisely to the "technological development and innovation" support activity.
Input and output indicators by primary and support process
Table 2 summarizes the number of inputs, outputs, and indicators associated with each primary process in the chain. Agricultural production (12), harvesting (13), and sugar production (14) accounted for the highest numbers of input indicators, respectively; these were primarily associated with the control of physical resources—such as land, water, varieties, and machinery—as well as raw material quality at the time of cutting. Sugar production recorded the highest number of output indicators (n=14), linked to industrial yield and finished product quality. In contrast, commercialization showed the fewest documented outputs (n=3) despite a comparatively high number of inputs (n=7) and input indicators (n=11). This suggests a chain with more advanced measurement systems in its production links than in its commercial link—a finding that contrasts with the importance Beamon (1998) and Gunasekaran et al. (2004) attributed to customer service and commercial responsiveness indicators within a balanced performance measurement system.
|
Table 2. Inputs, outputs, and indicators by primary process of the value chain |
|||||
|
Primary process |
Inputs |
Input indicators |
Outputs |
Output indicators |
Total |
|
Agricultural and livestock production |
8 |
12 |
8 |
16 |
28 |
|
Harvesting |
6 |
13 |
7 |
14 |
27 |
|
Sugar production |
8 |
14 |
6 |
14 |
28 |
|
Production of derivatives |
8 |
9 |
5 |
12 |
21 |
|
Marketing |
7 |
11 |
3 |
9 |
20 |
|
Total |
37 |
59 |
29 |
65 |
124 |
The support activities comprised a total of 15 management sub-processes: three in supply acquisition (importation, procurement of raw materials and domestic supplies, and services); four in planning, financing, and internal control (external finance, internal finance, internal control, and planning); four in human resource management (employment and wages, capacity building, occupational health and safety, and personnel management); and four in technological development and innovation (research, new technologies, continuous improvement, and social and environmental responsibility). As previously noted, none of these sub-processes included explicit quantitative indicators in the matrix; this limited the ability to systematically track numerical data regarding aspects such as staff numbers and qualifications, access to external credit, or the implementation of environmental and quality management systems—all of which were documented solely as qualitative inputs or outputs.
Distribution of indicators by performance and sustainability dimension
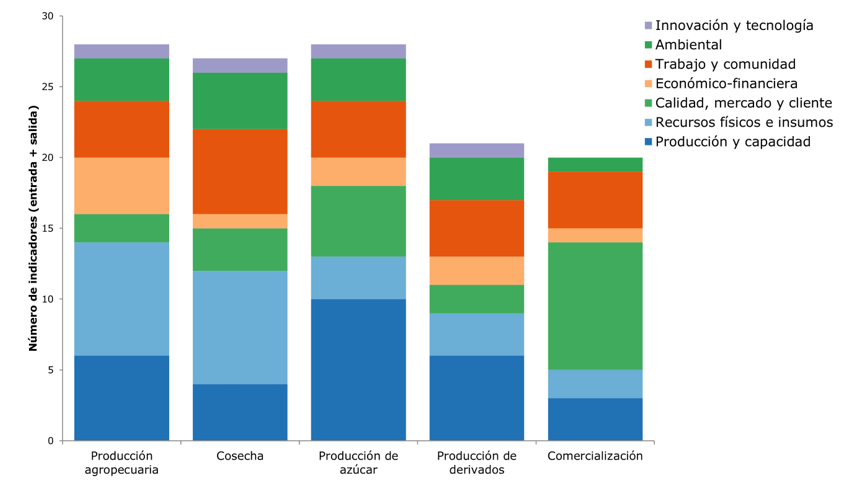
The 124 primary indicators, grouped according to the seven methodologically defined sustainability dimensions, yielded the distribution shown in Figure 3. The dimensions of “production and capacity” (23.4%) and “physical resources, inputs, and land” (19.4%) together accounted for nearly two-fifths of the indicator system, followed by “labor and community” (17.7%) and “quality, market, and customer” (16.9%). At the opposite end lie the economic-financial dimension (8.1%), the environmental dimension (11.3%), and the innovation and technology dimension—with only 3.2% of the indicators, the lowest of all analyzed categories—factors that could undermine the competitiveness of the chain.
Figure 3.
Distribution of the 124 relationships by primary process and performance and sustainability dimension
Source: own elaboration
Note: the figure appears in its original language
This distribution revealed a pattern diverging from that described in classical literature on performance measurement systems, which noted the historical predominance of financial indicators over operational ones (Kaplan & Norton, 1992; Neely et al., 1995); in the chain analyzed, the economic-financial dimension was among the least represented (8.1%), whereas the operational and physical resource dimensions accounted for the largest share of the system. This finding was consistent with the historical emphasis placed—within the Cuban sugar agro-industry management model—on the physical control of agricultural and industrial processes; however, it mirrored, in reverse, the very imbalance that Gunasekaran et al. (2004) and Neely et al. (1995) identified as undesirable: a system of indicators skewed toward the production-operational aspect, with gaps requiring analysis in the economic-financial, environmental, and innovation dimensions.
The low representation of the environmental dimension (11.3%) contrasted with the growing importance this dimension has gained in international literature regarding sugarcane sustainability, particularly in markets where the sector is strong, such as Brazil. Viegas et al. (2024) identified a predominance of environmental indicators in global sugarcane production, highlighting an increasing number of studies on carbon footprint and LCA applied to this agro-industry in Brazil (Bordonal et al., 2018; Ometto et al., 2009), Mexico (García et al., 2016), Thailand (Prasara-A et al., 2019; Yuttitham et al., 2011), and the Caribbean (Contreras-Lisperguer et al., 2018). In the Cuban supply chain analyzed, the identified environmental indicators were essentially limited to the percentage of burnt cane, foreign matter content, and specific indicators of environmental impacts associated with harvesting and industrial production; notably, no explicit indicators were identified for carbon footprint, water consumption, bagasse energy efficiency, or the management of waste and vinasse—despite the fact that international literature has extensively documented the potential of the latter as sources of environmental and energy value within the sugarcane value chain (Gonçalves et al., 2021; Jonker et al., 2016; Khatiwada et al., 2016).
Meanwhile, the innovation and technology dimension lacked quantitative indicators in support processes and included only four (3.2%) in primary processes; this stood in stark contrast to the central role that Hassoun et al. (2023) and Morella et al. (2021) attributed to digitalization and Industry 4.0 technologies—specifically the deployment of digital traceability tools, sensor systems, and real-time data analysis as explicit, measurable components of contemporary agrifood systems.
The “labor and community” dimension, accounting for 17.7% of the indicators, was comparatively more prominent than in other international studies on the sustainability of agri-food supply chains. Jabbour et al. (2013) and Orou Sannou et al. (2023) noted that, internationally, the social dimension was the least developed of the three pillars of the triple bottom line; consequently, the relatively high representation of labor and community indicators in the Cuban supply chain analyzed—linked primarily to occupational health and safety and community contributions—represented a relative strength of the system vis-à-vis international trends, even though this coexisted with a virtual absence of social indicators regarding participation or the perceptions of sugarcane-growing communities, attributes identified by Orou Sannou et al. (2023) as among the least explored.
Continuity of indicators between consecutive processes
Analyzing the alignment between the output indicators of one process and the input indicators of the subsequent one made it possible to estimate the degree of informational continuity across the chain—factors that foster integration and collaboration between links. The relationship between harvesting and sugar production demonstrated the highest level of continuity, with five shared indicators; this reflected the pivotal role of raw material quality as a critical control variable during the transition between these two processes, consistent with the importance attributed to potential sugarcane yield in recent Cuban studies on industrial forecasting (García et al., 2022; García-López et al., 2024). Conversely, the relationships between the sugar production and derivatives production links, between sugar production and commercialization, and between derivatives production and commercialization showed only one shared indicator—or none at all—suggesting limited explicit traceability of quality and performance data toward the final links of the chain. This discontinuity is significant when viewed in light of the arguments made by Beamon (1998) and Carter and Rogers (2008) regarding the need for visibility and traceability throughout the entire chain as a prerequisite for sustainable management.
Contrast with the international experience of the sugar agro-industry
Table 3 presents a comparative analysis—highlighting specific dimensions—of the Cuban sugar value chain against a set of international experiences documented in the literature. The comparison revealed that, while the international studies focused primarily on environmental and economic-production dimensions, the Cuban value chain exhibited an indicator profile oriented mainly toward physical production control and the labor and community dimensions, with less emphasis on environmental and economic-financial aspects—and, above all, on innovation and technology.
|
Table 3. Comparative analysis with a dimensional focus identified in the Cuban sugar value chain |
||
|
Experience |
Predominant dimensional emphasis |
Source |
|
Brazil (sugar and alcohol mills) |
Technical, environmental, and energy efficiency (cogeneration, LCA) |
Carlucci et al. (2021); Duarte et al. (2019); Lemos et al. (2019); Ometto et al. (2009) |
|
Thailand (cane-derived products) |
Carbon footprint and social and environmental sustainability |
Prasara-A et al. (2019); Yuttitham et al. (2011) |
|
Australia (transport and diversification) |
Harvest logistics and environmental product diversification |
Higgins (2006); Renouf et al. (2013) |
|
Jamaica (bagasse-based cogeneration) |
Integrated environmental, economic, and social sustainability (LCA) |
Contreras-Lisperguer et al. (2018) |
|
India (sugar supply chain) |
Systems dynamics applied to supply chain efficiency |
Singh et al. (2025); Tsiropoulos et al. (2014) |
|
Cuba (chain analyzed) |
Physical-production control and labor/community dimensions; low levels of environmental resources and innovation |
Present study |
This comparison did not imply a negative assessment of the Cuban sugar system under analysis, given that it responded to management priorities historically focused on physically securing production amidst severe material and financial constraints; however, it did reveal a concrete opportunity for modernization: the explicit incorporation of quantifiable environmental indicators—specifically regarding bagasse energy efficiency, waste and vinasse management, and water consumption—as well as indicators for innovation and digitalization in the corresponding support activities, in line with trends documented by Hassoun et al. (2023), Morella et al. (2021), and the body of environmental studies on sugarcane agro-industries reviewed in this work.
CONCLUSIONS
The input-output indicator system for the analyzed sugar value chain was structured into five primary processes and four support processes. While 124 relationships between indicators and primary processes were documented, the support activities lacked explicit quantitative indicators—despite encompassing functions crucial to the chain's sustainability, such as human resource management, financial planning, and technological development and innovation.
The distribution of indicators across sustainability dimensions revealed a concentration in the production and capacity dimension and the physical resources and inputs dimension, contrasted with comparatively low representation of the environmental and innovation/technology dimensions. This finding stood in contrast to the greater emphasis placed on these latter dimensions in recent international literature regarding sustainable sugar agro-industrial value chains and digitalization.
Analysis of process continuity revealed a higher density of shared indicators in the relationship between harvesting and sugar production—linked to raw material quality control—compared to virtually non-existent continuity regarding the derivative production and commercialization stages; this highlighted an opportunity to improve information traceability in the final segments of the chain.
The indicator system requires rebalancing toward environmental sustainability, innovation, and digitalization through the incorporation of explicit quantitative indicators for support activities and the chain’s final stages, without overlooking the relative strength shown by the labor and community dimension compared to documented international trends. A limitation of the study was its reliance on a single institutional document source coded by one researcher; future research could expand triangulation through multiple coding and time-series analysis of the indicators themselves, thereby consolidating a national reference framework for assessing sugar value chain sustainability.
REFERENCES
Ahi, P., & Searcy, C. (2013). A comparative literature analysis of definitions for green and sustainable supply chain management. Journal of Cleaner Production, 52, 329–341. https://doi.org/10.1016/j.jclepro.2013.02.018
Beamon, B. M. (1998). Supply chain design and analysis: Models and methods. International Journal of Production Economics, 55(3), 281–294. https://doi.org/10.1016/S0925-5273(98)00079-6
Bordonal, R. O., Carvalho, J. L. N., Lal, R., de Figueiredo, E. B., de Oliveira, B. G., & La Scala, N., Jr. (2018). Sustainability of sugarcane production in Brazil. A review. Agronomy for Sustainable Development, 38, 13. https://doi.org/10.1007/s13593-018-0490-x
Bourne, M., Mills, J., Wilcox, M., Neely, A., & Platts, K. (2000). Designing, implementing and updating performance measurement systems. International Journal of Operations & Production Management, 20(7), 754–771. https://doi.org/10.1108/01443570010330739
Carlucci, F. V., Lemos, S. V., Salgado, A. P., Jr., & Rebehy, P. C. P. W. (2021). Environmental, field and impurity factors to increase the agricultural performance of Brazilian and Australian sugarcane mills. Clean Technologies and Environmental Policy, 23, 2083–2100. https://doi.org/10.1007/s10098-021-02105-z
Carter, C. R., & Rogers, D. S. (2008). A framework of sustainable supply chain management: Moving toward new theory. International Journal of Physical Distribution & Logistics Management, 38(5), 360–387. https://doi.org/10.1108/09600030810882816
Carter, C. R., & Easton, P. L. (2011). Sustainable supply chain management: Evolution and future directions. International Journal of Physical Distribution & Logistics Management, 41(1), 46–62. https://doi.org/10.1108/09600031111101420
Chávez, M. M. M., Sarache, W., Costa, Y., & Soto, J. (2020). Multiobjective stochastic scheduling of upstream operations in a sustainable sugarcane supply chain. Journal of Cleaner Production, 276, 123305. https://doi.org/10.1016/j.jclepro.2020.123305
Contreras-Lisperguer, R., Batuecas, E., Mayo, C., Díaz, R., Pérez, F. J., & Springer, C. (2018). Sustainability assessment of electricity cogeneration from sugarcane bagasse in Jamaica. Journal of Cleaner Production, 200, 390–401. https://doi.org/10.1016/j.jclepro.2018.07.322
Correa-Porcel, V., Piedra-Muñoz, L., & Galdeano-Gómez, E. (2021). Water–energy–food nexus in the agri-food sector: Research trends and innovating practices. International Journal of Environmental Research and Public Health, 18(24), 12966. https://doi.org/10.3390/ijerph182412966
Duarte, A., Salgado Jr, A. P., Lemos, S. V., de Souza Jr, M. A. A., & de Almeida Antunes, F (2019). Proposal of operating best practices that contribute to the technical efficiency in Brazilian sugar and ethanol mills. Journal of Cleaner Production, 214, 173–184. https://doi.org/10.1016/j.jclepro.2018.12.204
Elkington, J. (1997). Cannibals with forks: The triple bottom line of 21st century business. Capstone.
García, C. A., García-Treviño, E. S., Aguilar-Rivera, N., & Armendáriz, C. (2016). Carbon footprint of sugar production in Mexico. Journal of Cleaner Production, 112(4), 2632–2641. https://doi.org/10.1016/j.jclepro.2015.09.113
García-López, Y., González-Sáez, L. Y., & Cabrera-Hernández, J. A. (2022). Aplicaciones de aprendizaje automático para el análisis industrial de la provisión azucarera en Matanzas, Cuba. Revista U.D.C.A Actualidad & Divulgación Científica, 25(2), e2334. https://doi.org/10.31910/rudca.v25.n2.2022.2334
García-López, Y., González-Sáez, L. Y., & Cabrera-Hernández, J. A. (2024). Pronóstico de la provisión azucarera agroindustrial en Matanzas, Cuba. Revista U.D.C.A Actualidad & Divulgación Científica, 27(2), e2555. https://doi.org/10.31910/rudca.v27.n2.2024.2555
Gereffi, G., Humphrey, J., & Sturgeon, T. (2005). The governance of global value chains. Review of International Political Economy, 12(1), 78–104. https://doi.org/10.1080/09692290500049805
Gilani, H., Sahebi, H., & Oliveira, F. (2020). Sustainable sugarcane-to-bioethanol supply chain network design: A robust possibilistic programming model. Applied Energy, 278, 115653. https://doi.org/10.1016/j.apenergy.2020.115653
Gonçalves, F., Perna, R., Lopes, E., Maciel, R., Tovar, L., & Lopes, M. (2021). Strategies to improve the environmental efficiency and the profitability of sugarcane mills. Biomass and Bioenergy, 148, 106052. https://doi.org/10.1016/j.biombioe.2021.106052
Gunasekaran, A., Patel, C., & McGaughey, R. E. (2004). A framework for supply chain performance measurement. International Journal of Production Economics, 87(3), 333–347. https://doi.org/10.1016/j.ijpe.2003.08.003
Gunasekaran, A., & Kobu, B. (2007). Performance measures and metrics in logistics and supply chain management: A review of recent literature (1995–2004) for research and applications. International Journal of Production Research, 45(12), 2819–2840. https://doi.org/10.1080/00207540600806513
Haghjoo, R., Choobchian, S., Morid, S., & Abbasi, E. (2022). Development and validation of management assessment tools considering water, food, and energy security nexus at the farm level. Environmental and Sustainability Indicators, 16, 100206. https://doi.org/10.1016/j.indic.2022.100206
Hamidov, A., & Helming, K. (2020). Sustainability considerations in water–energy–food nexus research in irrigated agriculture. Sustainability, 12(15), 6274. https://doi.org/10.3390/su12156274
Hassoun, A., Marvin, H. J. P., Bouzembrak, Y., Barba, F. J., Castagnini, J. M., Pallarés, N., Rabail, R., Aadil, R. M., Bangar, S. P., Bhat, R., Cropotova, J., Maqsood, S., & Regenstein, J. M. (2023). Digital transformation in the agri-food industry: Recent applications and the role of the COVID-19 pandemic. Frontiers in Sustainable Food Systems, 7, 1217813. https://doi.org/10.3389/fsufs.2023.1217813
Higgins, A. (2006). Scheduling of road vehicles in sugarcane transport: A case study at an Australian sugar mill. European Journal of Operational Research, 170(3), 987–1000. https://doi.org/10.1016/j.ejor.2004.07.055
Jabbour, A. B. L. de S., Arantes, A. F., & Jabbour, C. J. C. (2013). Green supply chain management: Mapping the territory. International Journal of Environment and Sustainable Development, 12(2), 145–167. https://doi.org/10.1504/IJESD.2013.052975
Jonker, J. G. G., Junginger, H. M., Verstegen, J. A., Lin, T., Rodríguez, L. F., Ting, K. C., Faaij, A. P. C., & van der Hilst, F. (2016). Supply chain optimization of sugarcane first generation and eucalyptus second generation ethanol production in Brazil. Applied Energy, 173, 494–510. https://doi.org/10.1016/j.apenergy.2016.04.069
Kadwa, M., & Bezuidenhout, C. N. (2015). Modelling sugarcane supply consistency at a sugar mill. Computers and Electronics in Agriculture, 111, 107–111. https://doi.org/10.1016/j.compag.2014.12.019
Kaplan, R. S., & Norton, D. P. (1992). The balanced scorecard—Measures that drive performance. Harvard Business Review, 70(1), 71–79.
Khatiwada, D., Leduc, S., Silveira, S., & McCallum, I. (2016). Optimizing ethanol and bioelectricity production in sugarcane biorefineries in Brazil. Renewable Energy, 85, 371–386. https://doi.org/10.1016/j.renene.2015.06.009
Lemos, S. V., Salgado, A. P., Jr., Duarte, A., de Souza, M. A. A., Jr., & Antunes, F. A. (2019). Agroindustrial best practices that contribute to technical efficiency in Brazilian sugar and ethanol production mills. Energy, 177, 397–411. https://doi.org/10.1016/j.energy.2019.04.053
Machado, R. L., & Da Cruz, T. V. (2022). An empirical approach analyzing the socioeconomic sustainability of the international sugarcane trade. Sustainability, 14(4), 2198. https://doi.org/10.3390/su14042198
Morella, P., Lambán, M. P., Royo, J., & Sánchez, J. C. (2021). Study and analysis of the implementation of 4.0 technologies in the agri-food supply chain: A state of the art. Agronomy, 11(12), 2526. https://doi.org/10.3390/agronomy11122526
Mota, B., Gomes, M. I., Carvalho, A., & Barbosa-Povoa, A. P. (2015). Towards supply chain sustainability: Economic, environmental and social design and planning. Journal of Cleaner Production, 105, 14–27. https://doi.org/10.1016/j.jclepro.2014.07.052
Neely, A., Gregory, M., & Platts, K. (1995). Performance measurement system design: A literature review and research agenda. International Journal of Operations & Production Management, 15(4), 80–116. https://doi.org/10.1108/01443579510083622
Neely, A., Mills, J., Platts, K., Richards, H., Gregory, M., Bourne, M., & Kennerley, M. (2000). Performance measurement system design: Developing and testing a process-based approach. International Journal of Operations & Production Management, 20(10), 1119–1145. https://doi.org/10.1108/01443570010343708
Ometto, A. R., Hauschild, M. Z., & Roma, W. N. L. (2009). Lifecycle assessment of fuel ethanol from sugarcane in Brazil. The International Journal of Life Cycle Assessment, 14, 236–247. https://doi.org/10.1007/s11367-009-0065-9
Orou Sannou, R., Kirschke, S., & Günther, E. (2023). Integrating the social perspective into the sustainability assessment of agri-food systems: A review of indicators. Sustainable Production and Consumption, 39, 175–190. https://doi.org/10.1016/j.spc.2023.05.014
Page, M. J., McKenzie, J. E., Bossuyt, P. M., Boutron, I., Hoffmann, T. C., Mulrow, C. D., Shamseer, L., Tetzlaff, J. M., Akl, E. A., Brennan, S. E., Chou, R., Glanville, J., Grimshaw, J. M., Hróbjartsson, A., Lalu, M. M., Li, T., Loder, E. W., Mayo-Wilson, E., McDonald, S., … Moher. (2021). The PRISMA 2020 statement: An updated guideline for reporting systematic reviews. BMJ, 372, n71. https://doi.org/10.1136/bmj.n71
Porter, M. E. (1985). Competitive advantage: Creating and sustaining superior performance. Free Press.
Prasara-A, J., Gheewala, S. H., Silalertruksa, T., Pongpat, P., & Sawaengsak, W. (2019). Environmental and social life cycle assessment to enhance sustainability of sugarcane-based products in Thailand. Clean Technologies and Environmental Policy, 21, 1447–1458. https://doi.org/10.1007/s10098-019-01715-y
Renouf, M. A., Pagan, R. J., & Wegener, M. K. (2013). Bio-production from Australian sugarcane: An environmental investigation of product diversification in an agro-industry. Journal of Cleaner Production, 39, 87–96. https://doi.org/10.1016/j.jclepro.2012.08.036
Rodrigues, T. G., & Machado, R. L. (2024). Life cycle assessment of the sugarcane supply chain in the Brazilian Midwest region. Sustainability, 16(1), 285. https://doi.org/10.3390/su16010285
Sánchez Suárez, Y., Samá Muñoz, D., Pancorbo Sandoval, J. A., Domínguez Díaz, L. E., Hernández Nariño, A., Marqués León, M., & Espinosa Blanco, M. A. (2026). Sustainable sugar agro-industrial value chain: An integrated lean framework for risk management, circularity, and artificial intelligence. Sustainability, 18(13), 6389. https://doi.org/10.3390/su18136389
Santoro, E., Soler, E. M., & Cherri, A. C. (2017). Route optimization in mechanized sugarcane harvesting. Computers and Electronics in Agriculture, 141, 140–146. https://doi.org/10.1016/j.compag.2017.07.013
Seuring, S., & Müller, M. (2008). From a literature review to a conceptual framework for sustainable supply chain management. Journal of Cleaner Production, 16(15), 1699–1710. https://doi.org/10.1016/j.jclepro.2008.04.020
Singh, S., Srivastava, S. K., & Jangirala, S. (2025). System Dynamics Analysis of Sugarcane Supply Chain in Indian Sugar Industry. Global Business Review, 26(2), 468-480. https://doi.org/10.1177/0972150921999521
Tsiropoulos, I., Faaij, A. P. C., Seabra, J. E. A., Lundquist, L., Schenker, U., Briois, J. F., & Patel, M. K. (2014). Life cycle assessment of sugarcane ethanol production in India in comparison to Brazil. The International Journal of Life Cycle Assessment, 19, 1049–1067. https://doi.org/10.1007/s11367-014-0714-5
Viegas, G. C., Marta-Costa, A., Fragoso, R., & Cambaza, E. (2024). The sustainability of sugarcane production: A systematic review of sustainability indicators. New Medit, 23(4), 121–134. https://doi.org/10.30682/nm2404h
Walters, D., & Lancaster, G. (2000). Implementing value strategy through the value chain. Management Decision, 38(3), 160–178. https://doi.org/10.1108/EUM0000000005344
Yuttitham, M., Gheewala, S. H., & Chidthaisong, A. (2011). Carbon footprint of sugar produced from sugarcane in eastern Thailand. Journal of Cleaner Production, 19(17-18), 2119–2127. https://doi.org/10.1016/j.jclepro.2011.07.017
Zarei, S., Bozorg-Haddad, O., Singh, V. P., & Loáiciga, H. A. (2021). Developing water, energy, and food sustainability performance indicators for agricultural systems. Scientific Reports, 11(1), 22831. https://doi.org/10.1038/s41598-021-02147-9
FINANCING
The authors received no funding for the development of this research.
CONFLICT OF INTEREST STATEMENT
The authors declare that there is no conflict of interest.
USE OF ARTIFICIAL INTELLIGENCE STATEMENT
No AI was used in the development of the article.
AUTHORSHIP CONTRIBUTION
Conceptualization: Yasniel Sánchez Suárez, Pietro Mendonça de Santis Sica, Darian Samá Muñoz.
Data curation: Darian Samá Muñoz.
Formal analysis: Yasniel Sánchez Suárez, Pietro Mendonça de Santis Sica.
Research: Yasniel Sánchez Suárez, Pietro Mendonça de Santis Sica, Darian Samá Muñoz.
Methodology: Yasniel Sánchez Suárez, Pietro Mendonça de Santis Sica, Darian Samá Muñoz.
Project administration: Yasniel Sánchez Suárez.
Software: Yasniel Sánchez Suárez, Pietro Mendonça de Santis Sica.
Supervision: Pietro Mendonça de Santis Sica.
Validation: Yasniel Sánchez Suárez, Pietro Mendonça de Santis Sica.
Visualization: Yasniel Sánchez Suárez, Pietro Mendonça de Santis Sica.
Writing – original draft: Yasniel Sánchez Suárez.
Writing – proofreading and editing: Pietro Mendonça de Santis Sica, Darian Samá Muñoz.